Gantt Chart
The project timeline for the WiseTrap Honeypot Framework was planned and managed using a Gantt chart to ensure proper scheduling and structured task distribution across the development phases.
The Gantt chart represents the overall project activities, including system design, implementation, testing, and evaluation. It provides a clear visualization of task durations, dependencies, and milestones throughout the project lifecycle.
The development process was organized into multiple Scrum sprints, each focusing on specific components such as honeypot modules, logging system, dashboard development, and system integration.
The following Gantt chart illustrates the project schedule and sprint-based execution plan:
Project Timeline (Gantt Chart)
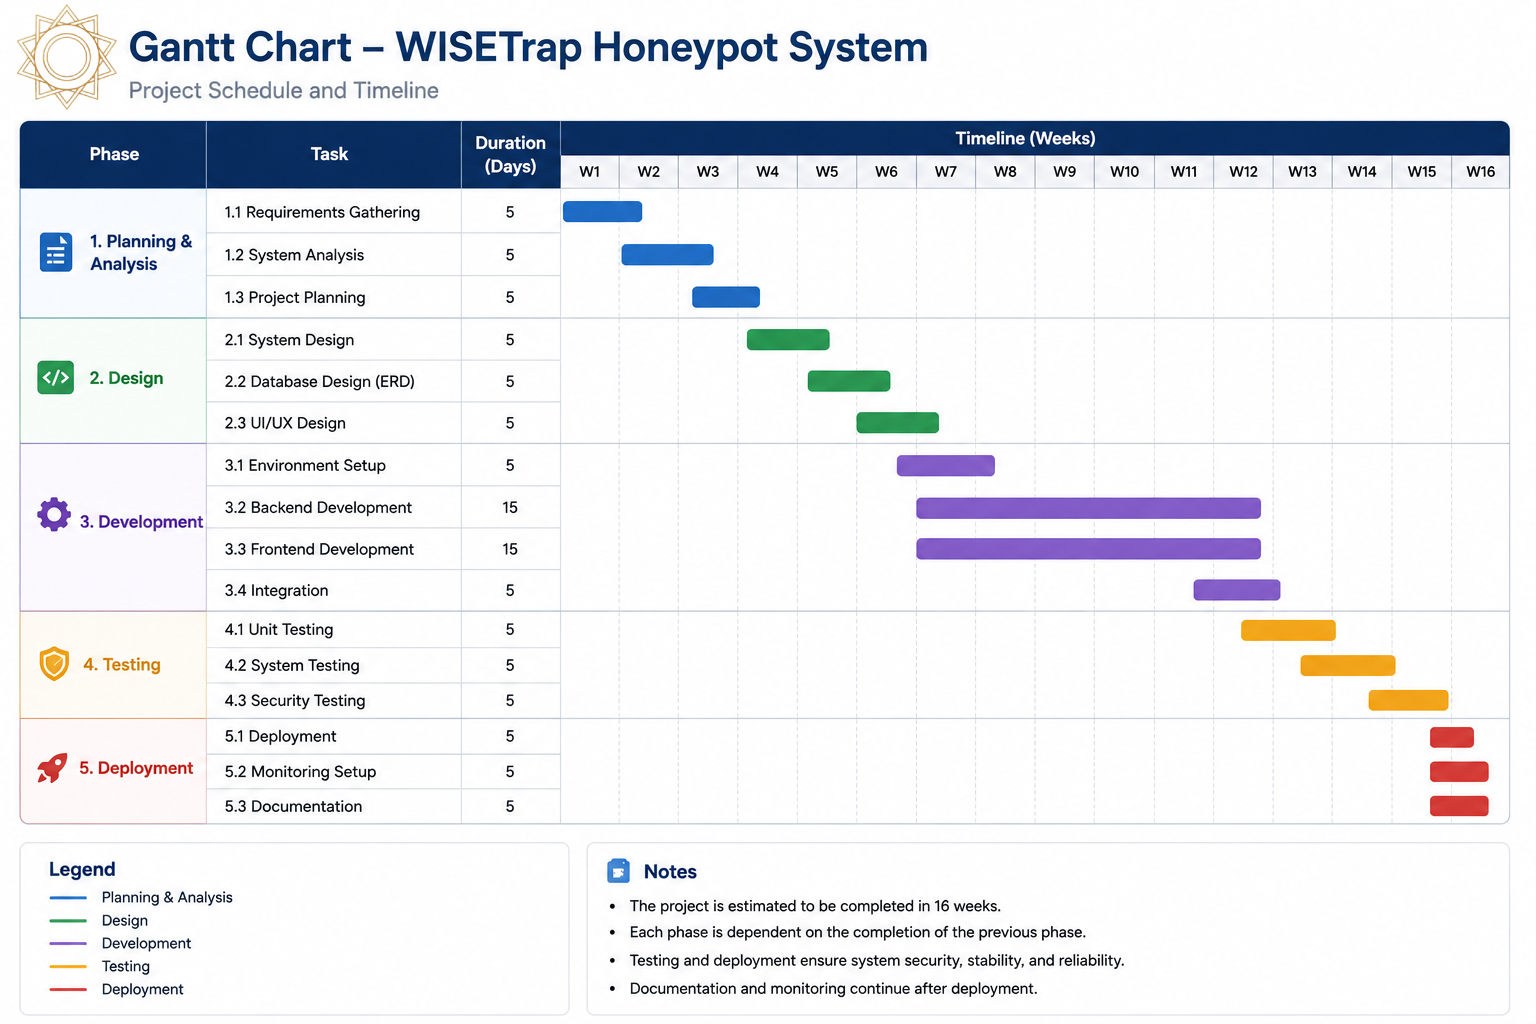
Source: WiseTrap Gantt Chart Wiki