Flowchart Diagram
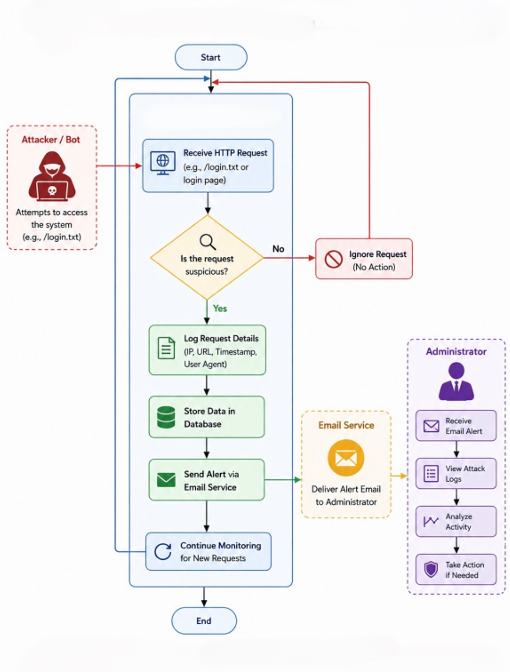
The Flowchart Diagram illustrates the operational workflow of the WiseTrap framework and describes how the system processes incoming requests and attack events.
The workflow begins when an external entity interacts with a simulated vulnerable endpoint exposed by the honeypot framework.
The framework then validates and processes the request, records attack-related information, stores logs within the database, and updates monitoring dashboards and analysis components.
Depending on the request type and vulnerability module involved, the system may also trigger alerts, categorize attack attempts, and generate structured monitoring records.
The flowchart simplifies the understanding of the request lifecycle and internal processing logic used by the framework.
Flowchart Diagram
Source: WiseTrap Flowchart Diagram Wiki